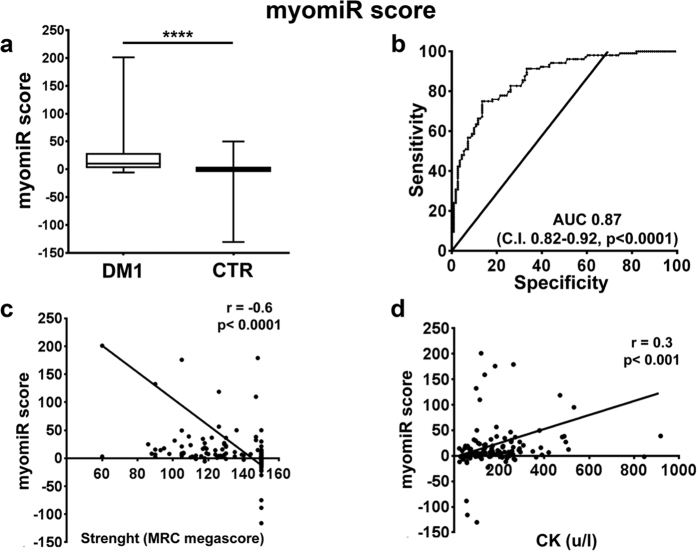
Figure 4. myomiR score validation as DM1 biomarker.
The myomiR score was calculated averaging the fold changes of miR-1, -133a, -133b, and -206 in the plasma of DM1 and controls (DM1 n = 103, CTR n = 111). (a) Box plot of myomiR score levels in the plasma of DM1 and controls (CTR; ****p < 0.0001). (b) ROC curve illustrating sensitivity and specificity of the myomiR score in discriminating healthy from diseased patients. (c) Spearman’s inverse correlation between the myomiR score and muscle strength measured by MRC megascore. (d) Spearman’s direct correlation between the myomiR score and CK plasma levels.

