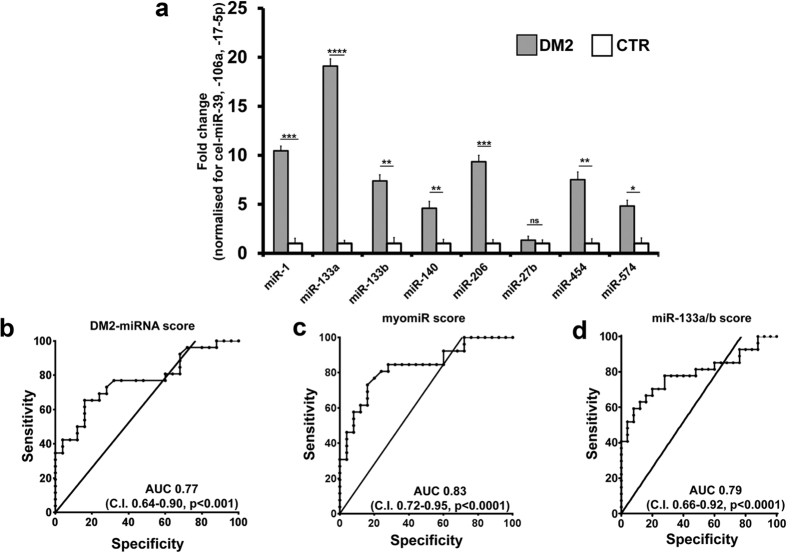
Figure 7. Validation of plasma miRNAs in DM2 patients.
(a) The bar graph represents mean values of the indicated miRNAs in plasma of DM2 patients compared to controls (CTR). Average values of cel-miR-39, miR106a and 17-5p were used for normalization (****p < 0.0001, ***p < 0.001, **p < 0.01,*p < 0.05). ROC curves illustrating sensitivity and specificity of DM2-miRNA score (b), myomiR (c) and miR-133a/b score (d) in discriminating healthy from disease patients. (DM2 n = 30, CTR n = 30).

