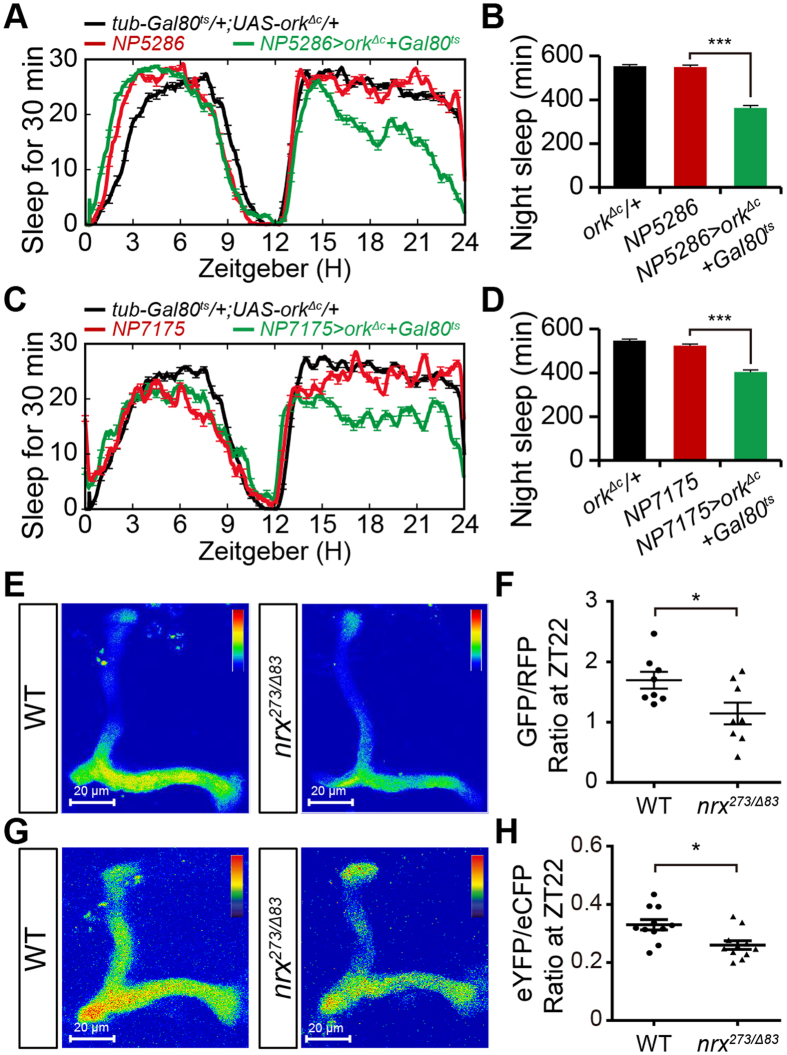
Figure 5. Blocking synaptic output from αβsc neurons reduces nighttime sleep.
(A,B) Average sleep profiles for NP5286/tub-GAL80ts;UAS-Ork1ΔC/+ and control flies, plotted as a 30 min moving average (A), and quantification of total nighttime sleep in NP5286/tub-GAL80ts;UAS-Ork1ΔC/+ and control flies (B) (n = 16). For (A) and (C), all flies were reared at 18 °C throughout development, and adults were entrained at 30 °C for 6 hours every day for 2 days. Then, the flies’ sleep was measured. (C,D) Average sleep profiles for NP7175/Y;tub-GAL80ts/+;UAS-Ork1ΔC/+ and control flies, plotted as a 30 min moving average (C), and quantification of total nighttime sleep in NP7175/Y;tub-GAL80ts/+;UAS-Ork1ΔC/+ and control flies (D) (n = 24). (E) Representative images of GCaMP6 fluorescence in both w1118 control and nrx273/Δ83 mutant αβ lobes. Images show the sum of fluorescence intensity from multiple layers primarily consisting of αβ lobes at ZT22. (F) Quantification of GCaMP6/RFP fluorescence ratios in w1118 control and nrx273/Δ83 mutant αβ neurons at ZT22. RFP fluorescence was used as control (n = 8). (G) Averaged eYFP/eCFP fluorescence ratio in both w1118 control and nrx273/Δ83 mutant αβ lobes at ZT22. (H) Quantification of eYFP/eCFP ratios in w1118 control and nrx273/Δ83 mutant αβ neurons at ZT22 (n = 11).

