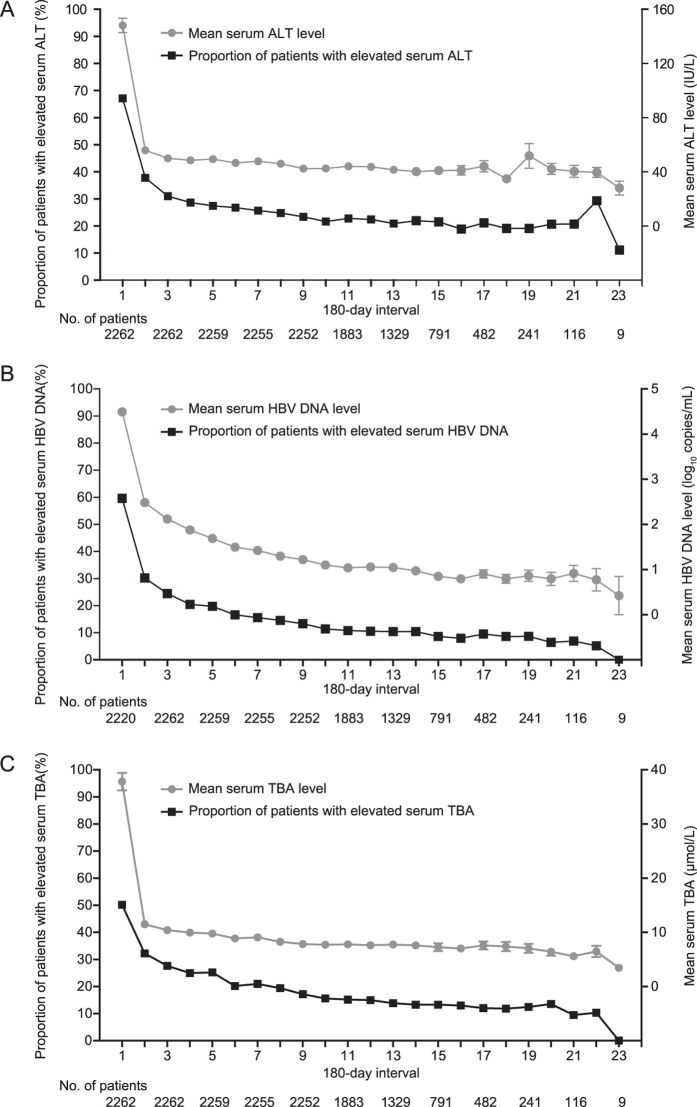
Figure 2. Long-term change of serum ALT, HBV DNA, and TBA.
(A) Long-term change of serum ALT. Filled rectangles indicate the proportion of patients with elevated serum ALT in each 180-day interval. Filled circles indicate the mean of serum ALT in each 180-day interval and horizontal bars depict standard error. (B) Long-term change of serum HBV DNA. Filled rectangles indicate the proportion of patients with elevated serum HBV DNA in each 180-day interval. Filled circles indicate the mean of serum HBV DNA (log transformed) in each 180-day interval and horizontal bars depict standard error. For HBV DNA below the detection limit of 50 copies/mL, HBV DNA level was set to 1 copies/mL before log transforming. A total of 42 patients have no HBV DNA records in the first 180-day interval. (C) Long-term change of serum TBA. Filled rectangles indicate the proportion of patients with elevated serum TBA in each 180-day interval. Filled circles indicate the mean of serum TBA in each 180-day interval and horizontal bars depict standard error.

