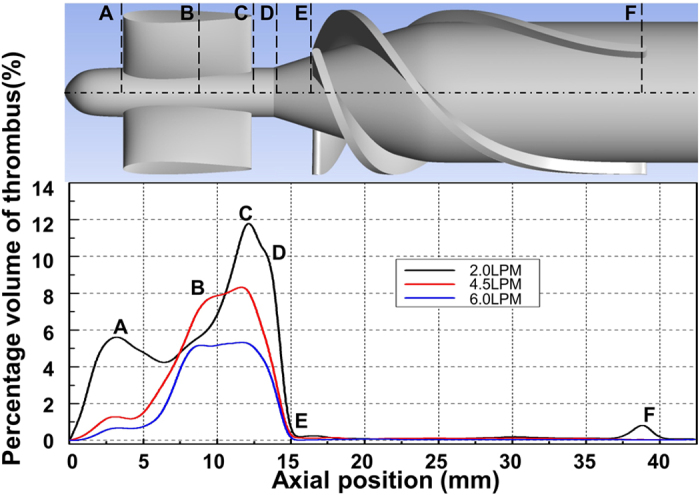
Figure 9. Thrombus accumulation (at t = 6.25 hours) along axial direction at different flow rates with 9000 RPM.

The percentage volume of thrombus here is the proportion of the local fluid domain along axial direction occupied by thrombus. The axial position of the lines shown in the figure are: A = 3.8 mm, B = 8.0 mm, C = 12.9 mm, D = 14.2 mm, E = 16.5 mm and F = 39.0 mm.
