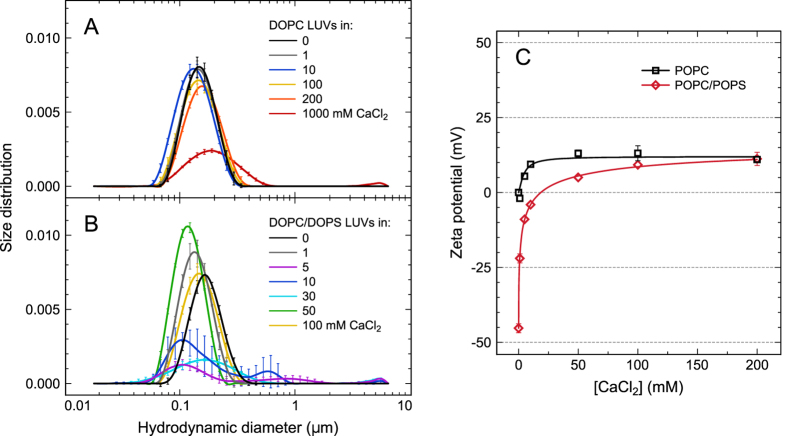
Figure 1. Liposome size distribution and zeta potential.
(A,B) Hydrodynamic diameter of extruded large unilamellar vesicles composed of DOPC (A) and DOPC/DOPS (4:1, mol:mol) (B). Error bars represent SD, n ≥ 4. (C) Zeta potential of POPC and POPC/POPS (4:1, mol:mol) large unilamellar vesicles measured as a function of CaCl2 concentration. Error bars represent SD, n ≥ 3. Data fitted with Langmuir-Freundlich model.

