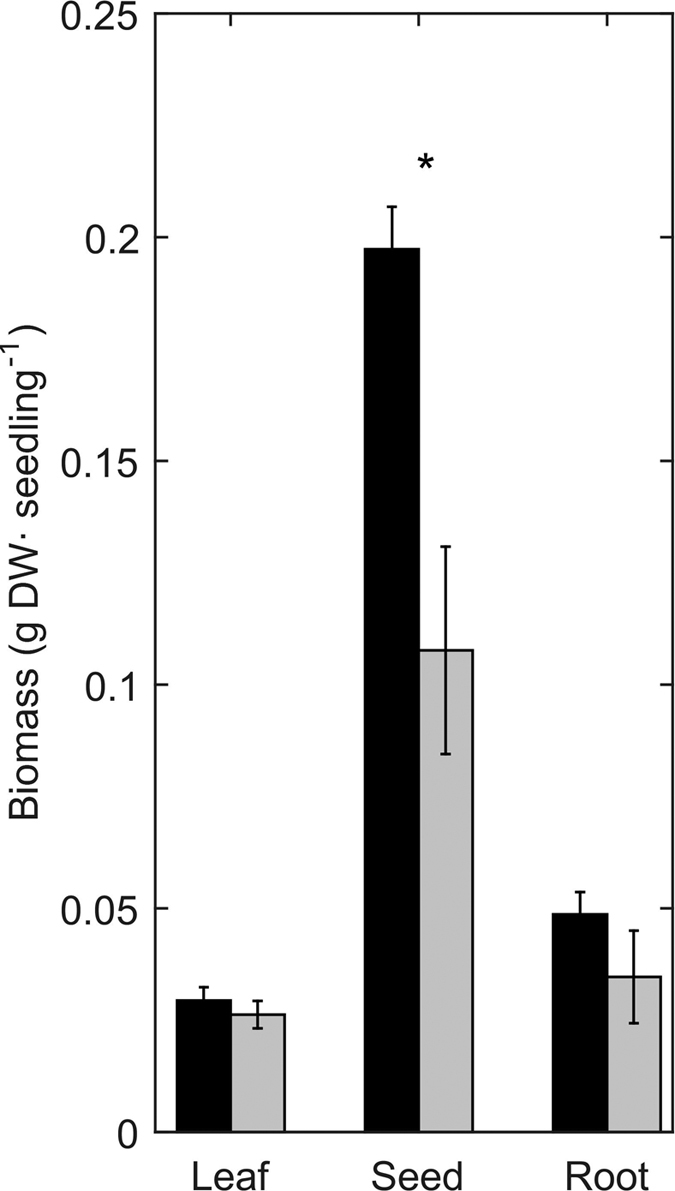
Figure 2. Mean dry Biomass (g) of leaves, seeds and roots of seedlings growing under high CO2 (black) or control (grey) conditions.

Error bars indicate standard error. Asterisk indicates statistically significant differences between treatments.

Error bars indicate standard error. Asterisk indicates statistically significant differences between treatments.