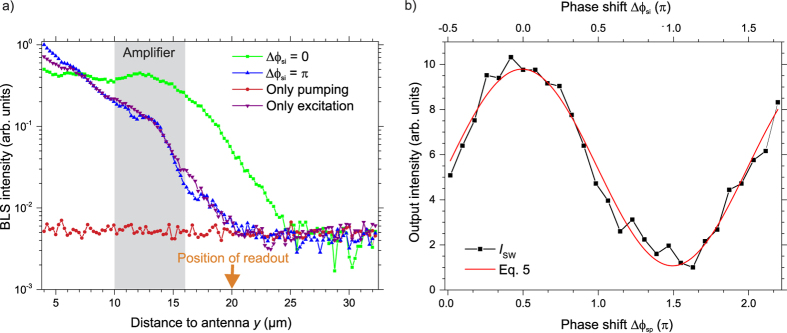
Figure 2.
(a) BLS intensity (logarithmic scale) as a function of the distance to the micro-strip antenna. Green rectangles and blue upward triangles: Spin-wave intensity arising from the interplay between the parametric amplification and the spin-wave excitation. Between these two measurements, the phase of the pumping field ϕp,0 was shifted. Red circles: Pumping only. Violet downward triangles: spin-wave excitation at the antenna only. The shading represents the spatial extent of the amplifier. (b) Intensity measured at a distance of 7 μm (marked by the orange arrow in (a)) behind the centre of the amplifier as a function of the induced phase shift Δϕsp between the signal wave and the pumping field as well as of the resulting phase shift Δϕsi between the signal and the idler waves. The red line represents a fit according to Eq. 5.

