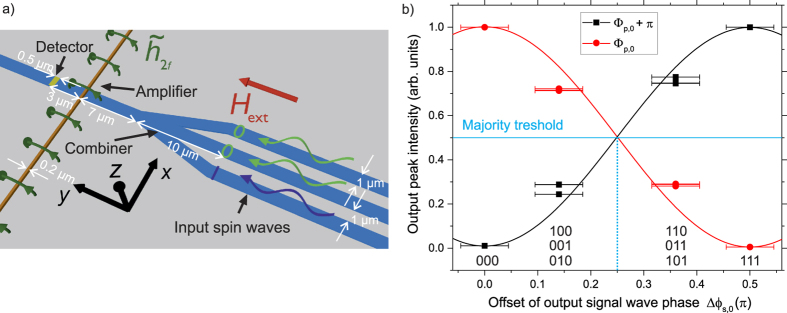
Figure 3.
(a) Schematic of the simulated majority gate featuring a parametric amplifier to facilitate the readout of the phase information and relevant dimensions of the structure. The wavy arrows represent input spin waves with Δϕs,0 = 0 (logic 0, green) and Δϕs,0 = 0.5π (logic 1, blue), respectively. (b) Output spin-wave intensity as a function of the offset of the phase of the signal spin wave Δϕs,0 in the output waveguide represented by red circles (reference phase ϕp,0) and black squares (reference phase ϕp,0 + π) (see Fig. S2 in the supplementary material for more detail). The solid lines represent Eq. 5.

