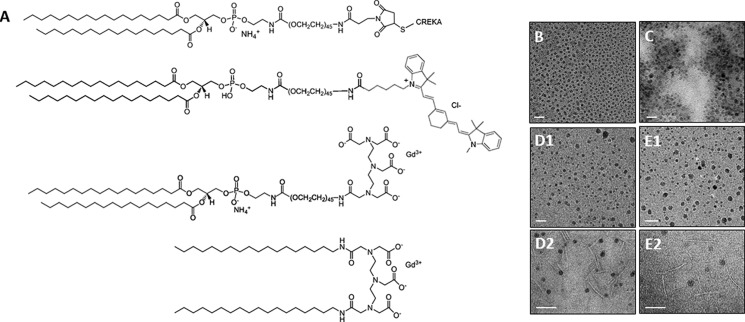
Figure 1.
Molecular structure of (A) DSPE-PEG2000-CREKA (top), DSPE-PEG2000-cy7, DSPE-PEG2000-DTPA(Gd), DTPA-BSA(Gd) (bottom). Transmission electron microscopy (TEM) images of (B) CREKA/DSPE-PEG2000–DTPA(Gd), (C) NT/DSPE-PEG2000-DTPA(Gd), (D1) spherical population of CREKA/DTPA-BSA(Gd), (E1) spherical population of NT/DTPA-BSA(Gd), (D2) cylindrical population of CREKA/DTPA-BSA(Gd), and (E2) cylindrical population of NT/DTPA-BSA(Gd). SB: 20 nm (B–E1), 100 nm (D2, E2).

