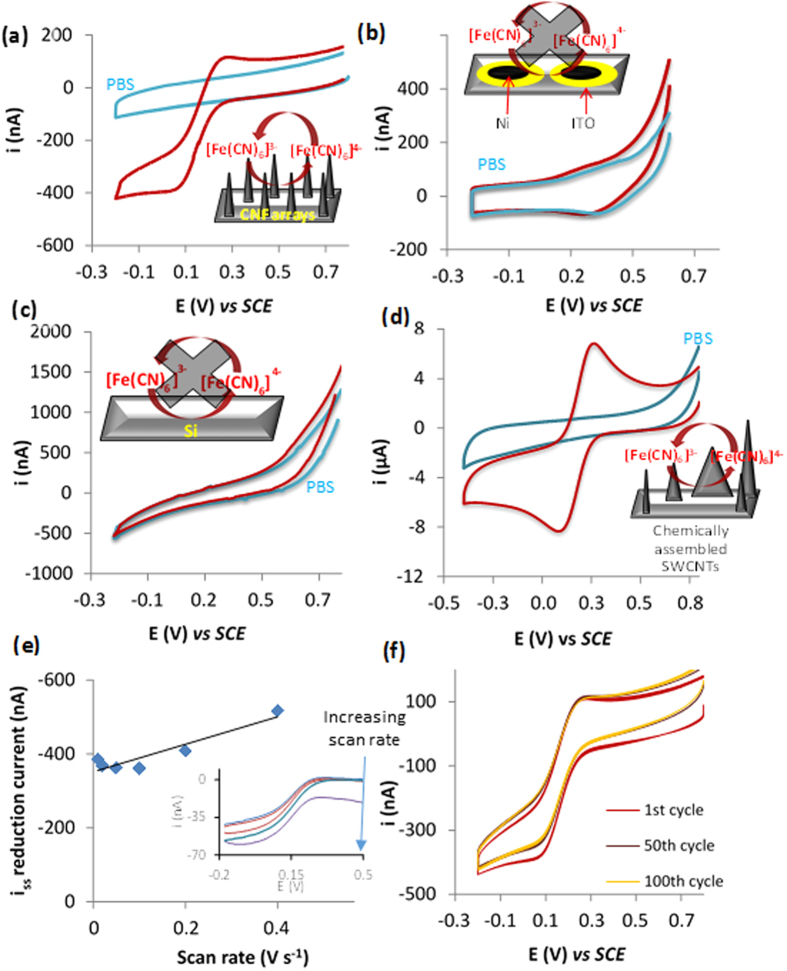
Figure 2.
Typical cyclic voltammograms obtained for silicon patterned with random arrays of CNFs (a), Si patterned with ITO and nickel (b) and bare silicon electrodes (c) and chemically assembled SWCNTs (d) for solutions of PBS (blue line) and solutions of PBS containing 250 μM ferricyanide (red line) at a scan rate of 0.1 V s−1. Voltammograms were performed from a positive to negative direction. Plot of steady state reduction current obtained from voltammograms of 250 μM ferricyanide (Inset) against varying scan rates for CNF patterned electrodes (e). Typical cyclic voltammograms obtained at CNF patterned electrodes for solutions of 250 μM ferricyanide at 0.1 mV s−1 after 100 consecutive scans (f).

