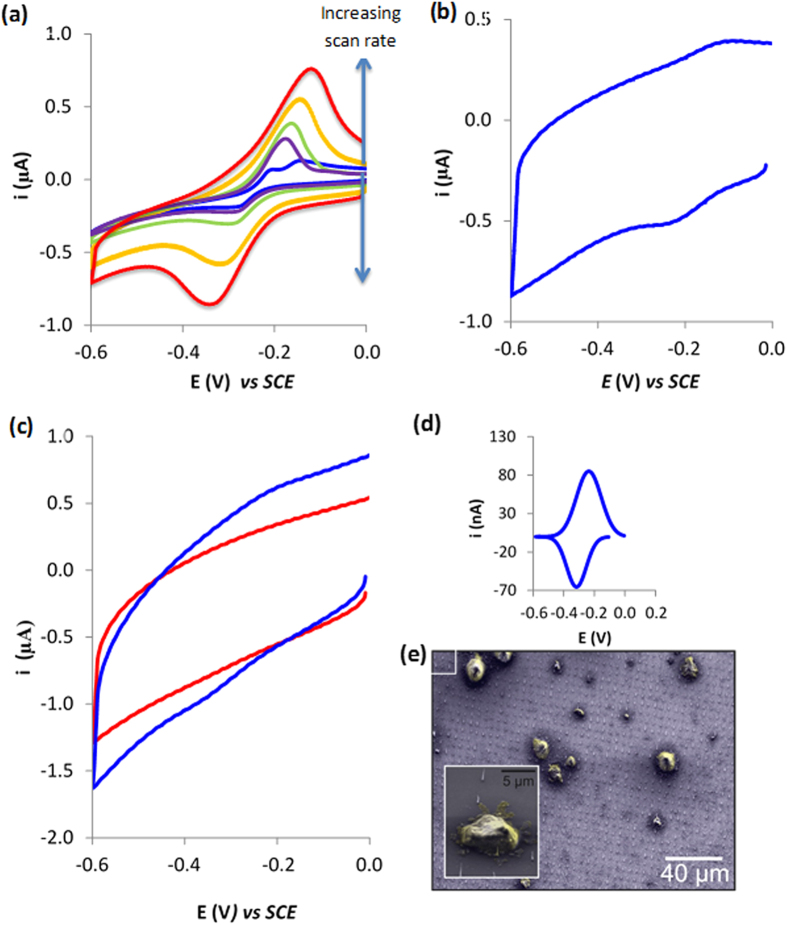
Figure 3.
(a) Typical cyclic voltammograms obtained with solutions of 500 μM methylene blue for ordered CNF microarray electrodes at varying scan rates including 0.01, 0.02, 0.05, 0.1, 0.2, 0.4 V s−1. (b) Typical cyclic voltammogram obtained for a ordered CNF microarray with absorbed methylene blue at 1 V s−1. (c) Typical cyclic voltammograms obtained at electrodes interfaced with cells exposed to methylene blue and either drop coated (red line) or centrifuged (blue line) obtained at 1 V s−1. (d) Inset is the integrated peak calculated using link fit software) that have been converted into current by multiplying it by the scan rate. (e) SEM image of cells centrifuged on to CNF microarray.

