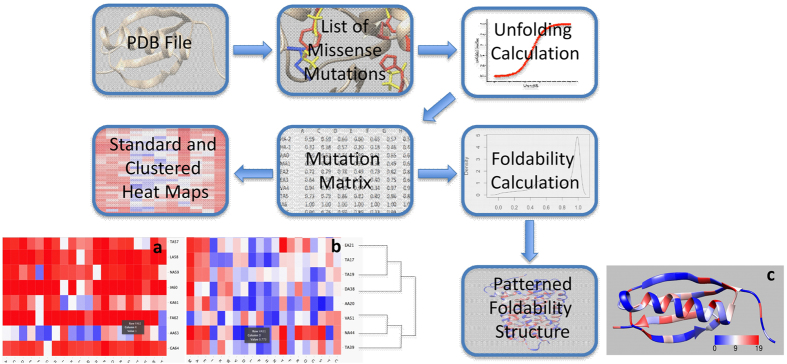
Figure 1. Schematic illustrating the workflow of the UMS process.
The input for the program is a PDB file. A list of all possible missense mutations is generated for the specific protein. Next, the unfolding propensity is calculated from the FoldX free energy change between the mutant and wild-type protein structure. The data are then sorted into a mutation matrix, which is used to construct the standard unfolding heat map (a). Adjacent to that map, the clustered unfolding heat map was built using a dendrogram to track the grouping of the data (b). The mutation matrix is also used in the foldability calculation described in the Methods section. Finally, these foldability values are used to color the foldability structure (c).

