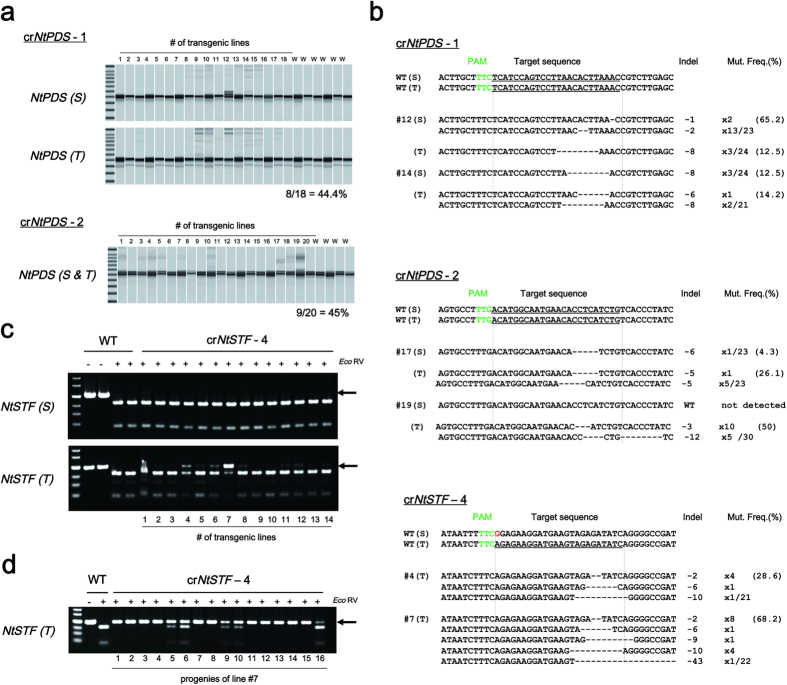
Figure 2. Analyses of FnCpf1-induced mutations in tobacco.
(a) Heteroduplex mobility assay to detect mutation on crNtPDS-1 (upper two panels) and crNtPDS-2 (lower panel) loci. (S) and (T) indicate PCR products amplified from the loci including each target sequence on N. sylvestris and N. tomentosiformis genomes, respectively. (b) Patterns of mutations detected in crNtPDS-1 (top), crNtPDS-2 (middle) and crNtSTF-4 (bottom) loci. The target DNA sequences of each crRNA are shown as wild-type (WT) at the top with underlined. (S) and (T) indicate the target sequence on both S and T genomes. The PAM regions are shown by green. Mismatched nucleotide is indicated in red. Line numbers of transgenic plants were indicated as # at left side of each sequence. DNA deletions are presented as dashes. The length of indel and the number of clones are represented at the right side of each sequence (+, insertion; −, deletion; ×, number of clones). Mut. Freq. (%): Mutation frequency. (c) CAPS analysis of crNtSTF-4 locus in T0 generation. (d) CAPS analysis of crNtSTF-4 locus in T1 generation of line #7. −: Non-digested PCR products, +: EcoRV-digested PCR products. Arrow head indicated the position of undigested PCR products. An undigested band indicates mutation at the crNtSTF-4 locus.

