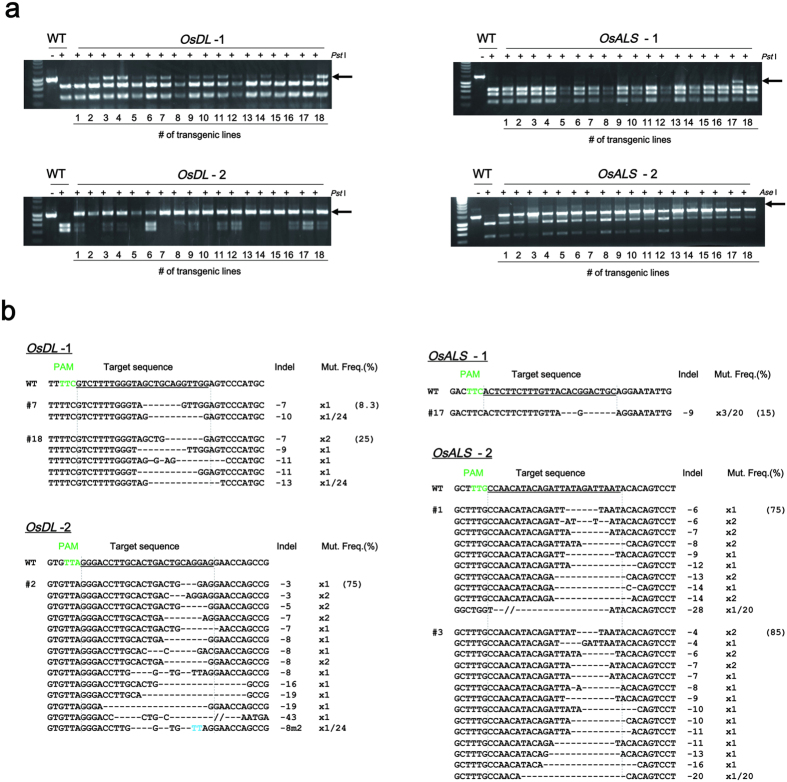
Figure 3. Analyses of FnCpf1-induced mutations in rice.
(a) CAPS analysis of crOsDL-1~2 and crOsALS-1~2 loci. −: Non-digested PCR products, +: PstI or AseI-digested PCR products. Arrow head indicated the position of undigested PCR products. An undigested band indicates mutation in the target loci. (b) Patterns of mutations detected in crOsDL-1~2 and crOsALS-1~2 loci. The target DNA sequences of each crRNA are shown as wild-type (WT) at the top with underlined. (S) and (T) indicate the target sequence on both S and T genomes. The PAM regions are shown by green. Mismatched nucleotide is indicated in red. Line numbers of transgenic plants were indicated as # at left side of each sequence. DNA deletions are presented as dashes. The length of indel and the number of clones are represented at the right side of each sequence (+, insertion; −, deletion; ×, number of clones). Mut. Freq. (%): Mutation frequency.

