An official website of the United States government
Here's how you know
Official websites use .gov
A
.gov website belongs to an official
government organization in the United States.
Secure .gov websites use HTTPS
A lock (
) or https:// means you've safely
connected to the .gov website. Share sensitive
information only on official, secure websites.
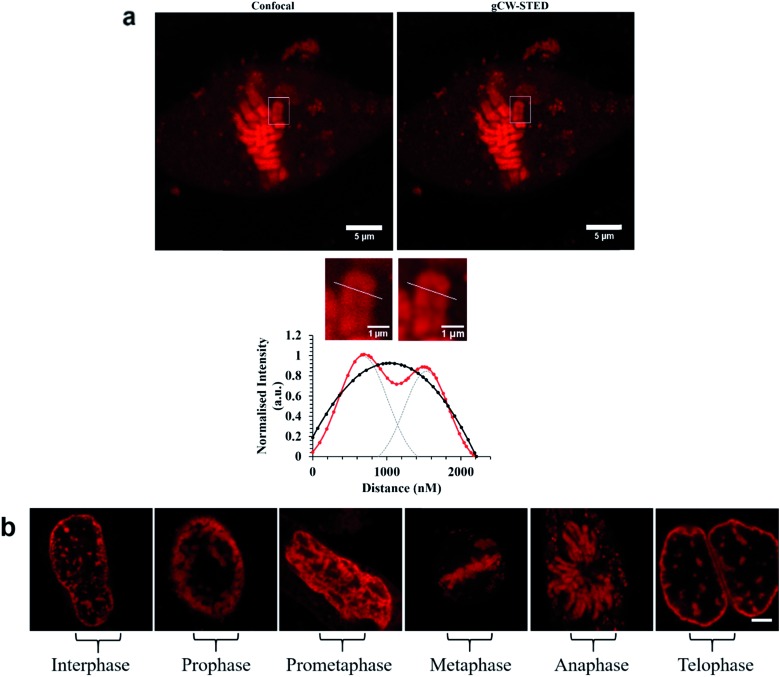
 ) compared to confocal (
 ). The FWHM was obtained by fitting fluorescence-intensity to Gaussian distributions (OriginPro). Two separated Gaussian distributions are indicated by grey dashed lines for the STED profile fitting. (b) STED images of Ru-NLS bound to DNA in the nucleus in fixed HeLa cells showing the different stages of cell division. HeLa cells were incubated with 40 μM complex for 24 h in the absence of light. The samples were fixed with 3.8% paraformaldehyde for 15 minutes, and then mounted with Prolong Gold for 24 h before imaging. Ru-NLS was excited at 470 nm white light laser and the emission was collected between 565 and 700 nm. The 660 nm STED depletion laser was used to acquire the STED images. Data is raw with no post-processing performed.