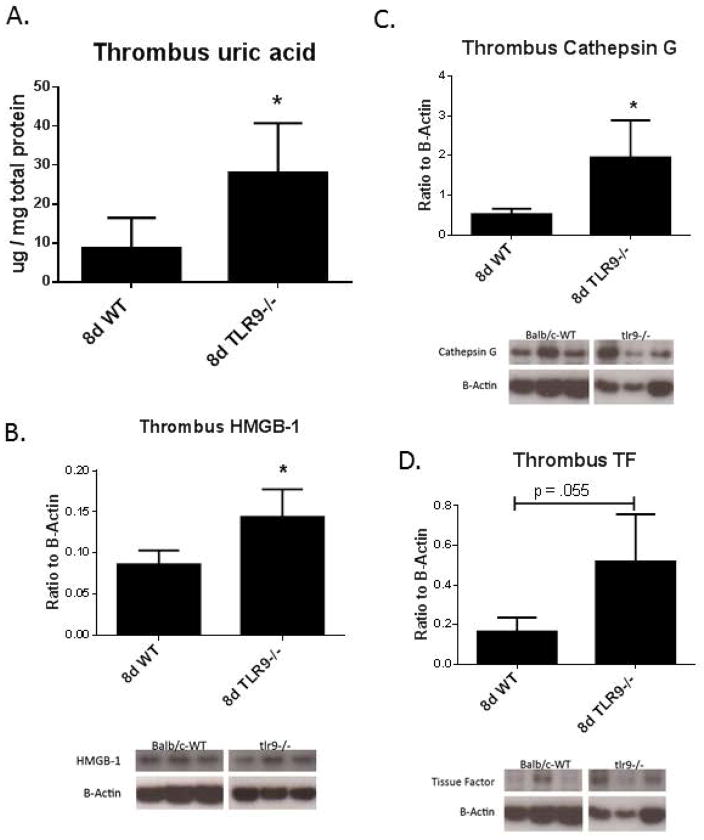
Figure 3.
A) Thrombus uric acid concentration was increased in Tlr9−/− mice at 8 d compared with WT controls; B) Thrombus HMGB-1 concentration was increased in Tlr9−/− thrombi at 8 d compared to WT controls. Markers of cellular thrombotic processes were all elevated in 8d Tlr9−/− as compared with WT by immunoblotting, including; C) Cathepsin G; and D) TF (all n = 5 – 7), * = p<.05 by t-Test. β-actin used as loading control.

