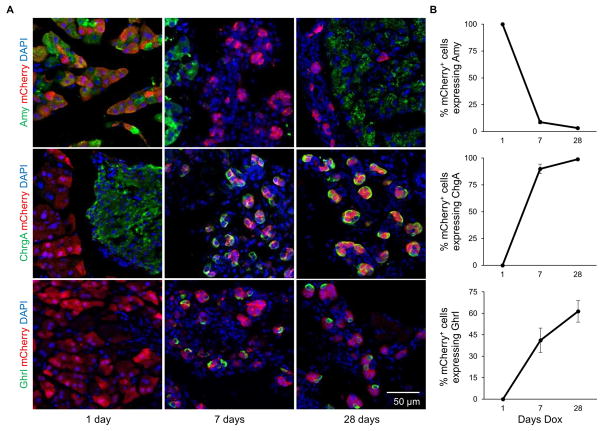
Figure 2. Temporal effects of 3TF overexpression in acinar cells.
(A) Animals were induced for 1, 7, or 28 days with dox. Immunofluorescence analysis revealed that amylase expression in mCherry+ cells decreased by 7 days and continued to decrease throughout the time course. Simultaneously, expression of chromogranin A and ghrelin began at 7 days and increased during the time-course. (B) Percentage of cells expressing amylase, chromogranin A and ghrelin among mCherry+ cells. Three mice per time point. Over 500 mCherry+ cells counted for each mouse. Data are represented as mean ± SEM. See also Figure S2 and Table S1–3.

