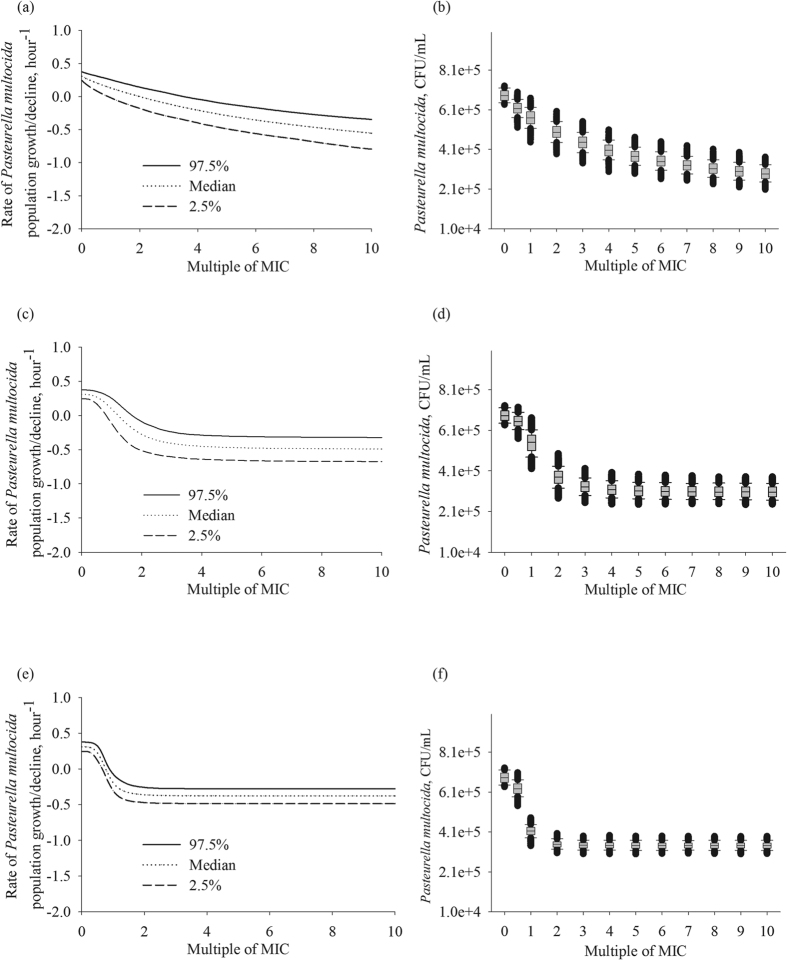
Figure 3.
The simulated distributions of the rate of bacterial population growth/decline for three Pasteurella multocida isolates: (a) isolate with enrofloxacin MIC = 0.01 μg/mL; (c) isolate with enrofloxacin MIC = 1.5 μg/mL; and (e) isolate with enrofloxacin MIC = 2.0 μg/mL. The resulting bacterial density after 1-hour exposure to different enrofloxacin concentrations standardized as multiples of the isolate’s MIC, with the starting density 5 × 10⁵ CFU/mL, for three Pasteurella multocida isolates: (b) isolate with enrofloxacin MIC = 0.01 μg/mL; (d) isolate with enrofloxacin MIC = 1.5 μg/mL; and (f) isolate with enrofloxacin MIC = 2.0 μg/mL. In each panel or box-plot, the outputs of 1,000 simulations for each enrofloxacin concentration of the best-fit pharmacodynamic model for the isolate are summarized. CFU – colony forming units.

