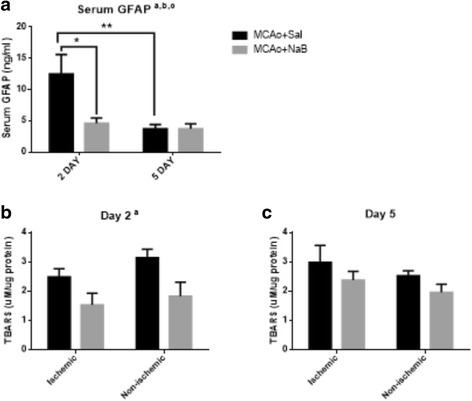
Fig. 4.

NaB treatment attenuates stroke-induced serum GFAP and brain TBARS at 2 days post stroke. a GFAP levels were measured from serum samples at 2 and 5 days post stroke. (B-C) TBARS levels were assessed from brain lysates at 2d (b) and 5d post stroke (c). All graphs represent mean ± S.E.M. n = 3–6 in each group. *p < 0.05 a: main effect of treatment, b: main effect of time, c: interaction effect (treatment X time). Two-way ANOVA with Tukey’s post hoc test. Repeated measures analysis (ischemic and non-ischemic hemisphere) for TBARS data
