Fig. 1.

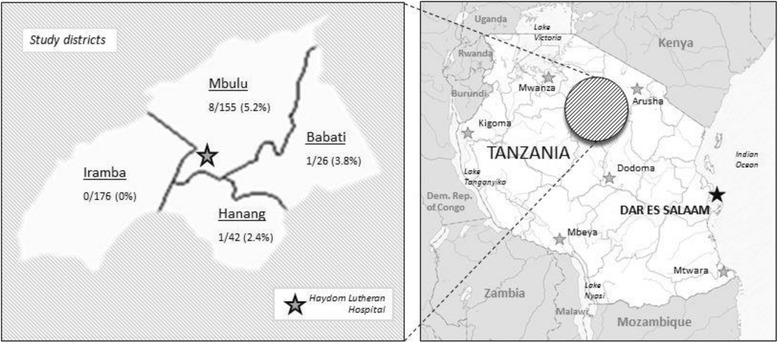
Map of study area and distribution of identified TSOL+ individuals of the initially recruited study population with known origin and serology (n = 399)

Map of study area and distribution of identified TSOL+ individuals of the initially recruited study population with known origin and serology (n = 399)