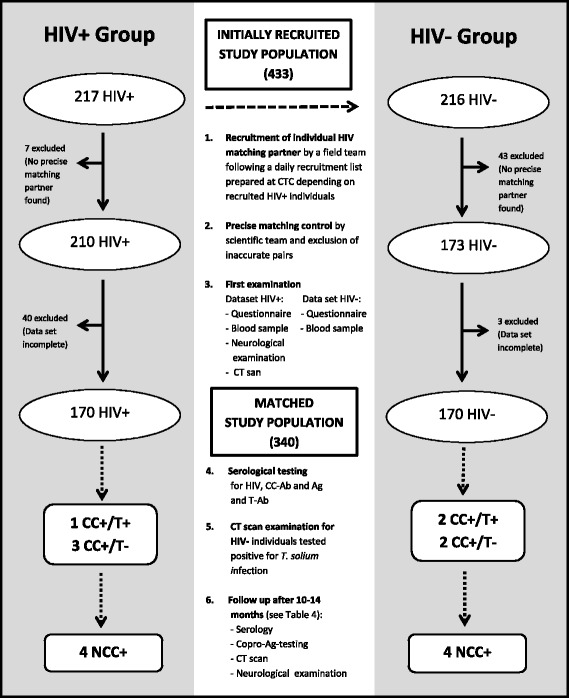
Fig. 2.

Flow chart of the initially recruited and matched study populations. HIV: human immunodeficiency virus, CT: computed tomography, CC: cysticercosis, T: taeniosis, NCC: neurocysticercosis, Ab: antibody; Ag: antigen

Flow chart of the initially recruited and matched study populations. HIV: human immunodeficiency virus, CT: computed tomography, CC: cysticercosis, T: taeniosis, NCC: neurocysticercosis, Ab: antibody; Ag: antigen