Fig. 1.

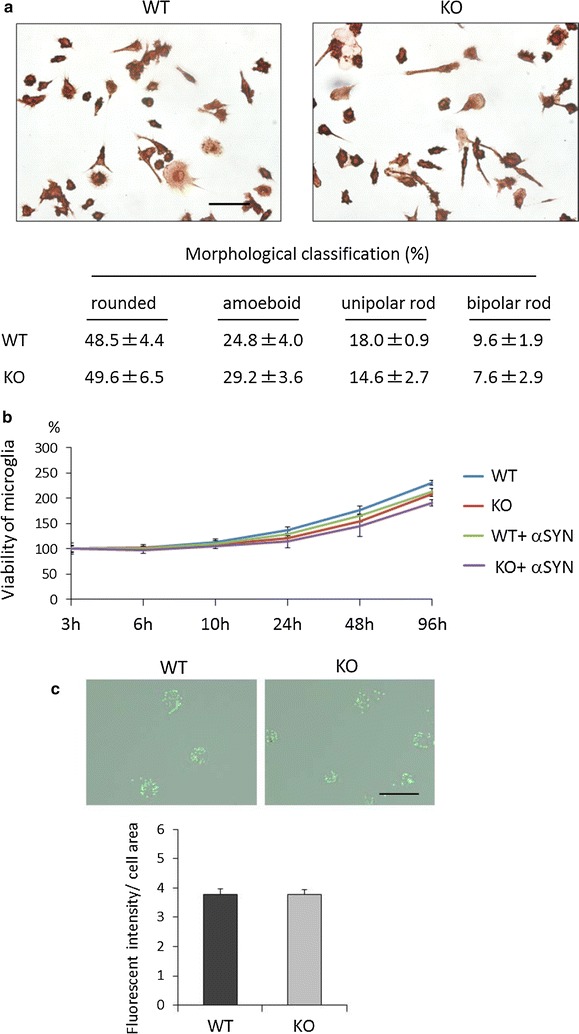
Characterization of LRRK2-KO microglia. a Tomato lectin staining of LRRK2-KO and WT microglia. One hundred cells were counted per culture well. n = 3 culture wells per group. Scale bar 50 μm. b MTT assay for evaluating the viability of LRRK2-KO and WT microglia in the absence or presence of αSYN. The data represent percentage viability relative to culture day 0, and were assessed by ANOVA at each time point (3 h: F = 0.26, p = 0.852; 6 h: F = 1.26, p = 0.351; 10 h: F = 0.94, p = 0.465; 24 h: F = 3.61, p = 0.065; 48 h: F = 2.55, p = 0.129; and 96 h: F = 3.46, p = 0.071). n = 3 culture wells per group. c Phagocytosis assay using FITC-microbeads. Upper panel shows an image of microbead phagocytosis. Scale bar 50 μm. Lower panel shows the fluorescence intensity of microbeads taken up by microglia. Forty cells were analyzed per group. The data are expressed as mean ± SD and were assessed by Student’s t test. These experiments were carried out three times using independent primary microglia isolated from different mice, and a representative image and data are shown
