
Fig. 6.
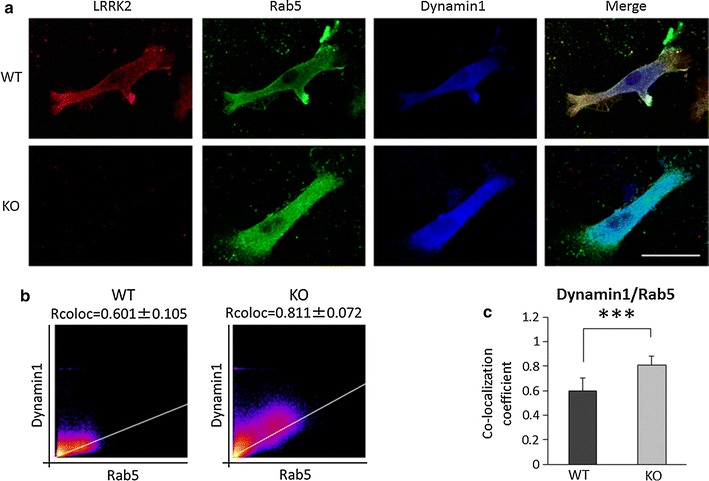
Increased co-localization between Rab5 and dynamin 1 in LRRK2-KO microglia. a Comparison of co-localization of Rab5 and dynamin 1 between KO and WT microglia. Confocal immunostaining images show LRRK2-, Rab5-, and dynamin1-immunopositive particles in the KO and WT microglia. Scale bar 10 μm. b Cytofluorograms of dynamin 1 and Rab5 immunostaining in KO and WT microglia. c The Rcoloc values of dynamin1/Rab5 in KO and WT microglia. Ten cells were analyzed per group. In the graphical representation, data are expressed as mean ± SD and were assessed by Student’s t test; ***p < 0.005. All experiments were carried out three times using primary microglia isolated from independent mice, and a representative image and data are shown