Fig. 1.

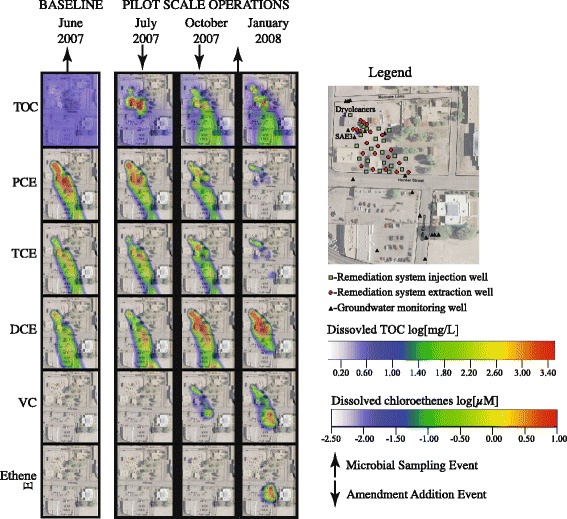
Heat map of TOC and VOCs during pilot scale operations at NRAP. Up- arrows indicate when microbial samples were collected; down arrows indicate when bioamendments were injected into the aquifer

Heat map of TOC and VOCs during pilot scale operations at NRAP. Up- arrows indicate when microbial samples were collected; down arrows indicate when bioamendments were injected into the aquifer