Fig. 4.

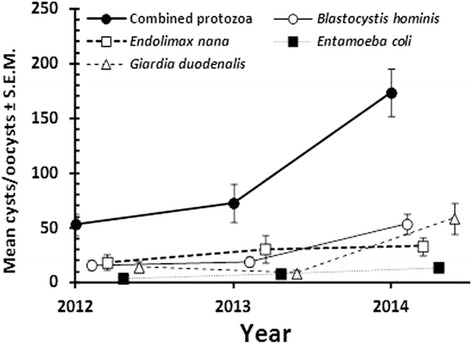
Temporal changes in the mean oocyst/cyst counts (in units of CPG) for combined protozoa, B. hominis, E. nana, E. coli and G. duodenalis. Values along the X-axis are offset slightly to avoid overlap of error bars

Temporal changes in the mean oocyst/cyst counts (in units of CPG) for combined protozoa, B. hominis, E. nana, E. coli and G. duodenalis. Values along the X-axis are offset slightly to avoid overlap of error bars