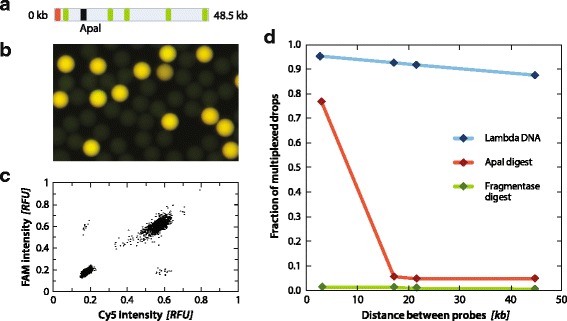
Fig. 3.

a Location of TaqMan PCR Cy5 probe in the lambda genome is shown in red, FAM probes are shown in green, and the location of the ApaI restriction site is shown in black. b Representative image of multiplexed PCR emulsion on Lambda DNA. c Representative scatterplot of Cy5 and FAM intensities for Lambda DNA. d Fraction of multiplexed droplets for Lambda DNA undigested (blue), ApaI digested (red), and Fragmentase digested (green)
