Fig. 4.

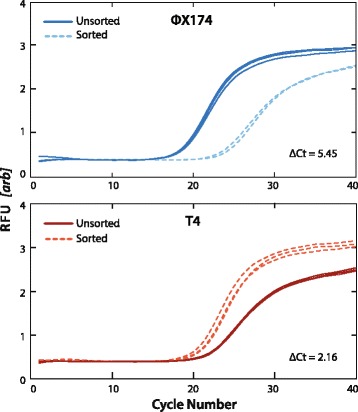
qPCR detection of bacteriophages фX174 and T4 before and after FACS sorting. The shifts in the curves reflect the 2-fold change of the DNA quantity according to the specific primers being tested. Samples tested in triplicate

qPCR detection of bacteriophages фX174 and T4 before and after FACS sorting. The shifts in the curves reflect the 2-fold change of the DNA quantity according to the specific primers being tested. Samples tested in triplicate