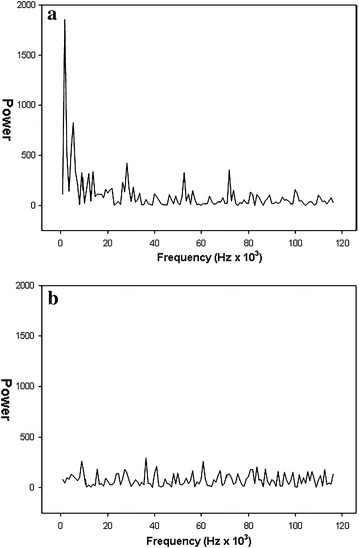
Fig. 3.

Fourier analysis of the mean velocity data for the SHR/NCrl (a) and WKY/NHsd rats (b) displayed in Fig. 2. Power spectral density (ordinate) is shown as a function of frequency (abscissa), and illustrates the difference in the ratio of variance in the high frequency as compared to the low frequency end of the spectrum between the two strains
