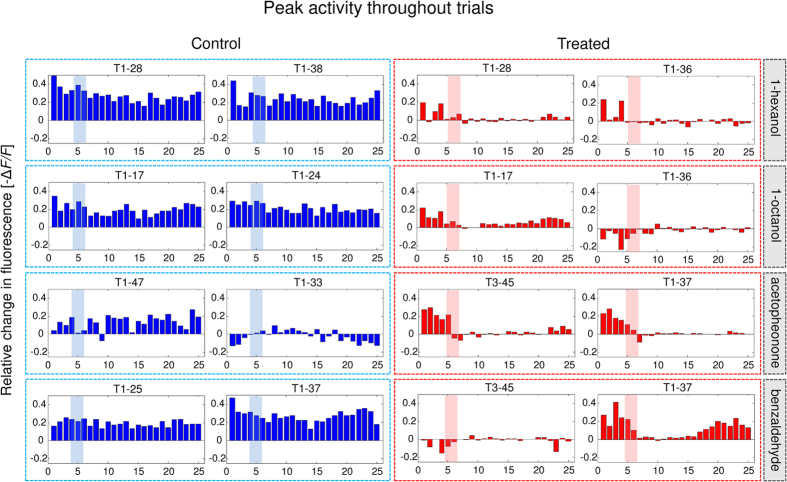
Figure 1. Example of two representative glomeruli of the odour response pattern relative to each odour in a control bee (left; blue) and a treated bee (right; red).
Odour-evoked responses (−ΔF/F) are averaged over the 200–400 ms interval after stimulus onset, for each of the 25 stimuli repetitions (shown on the x-axis). Odours are reported on the right. Shadows: administration of Ringer’s solution (blue) or imidacloprid (red).

