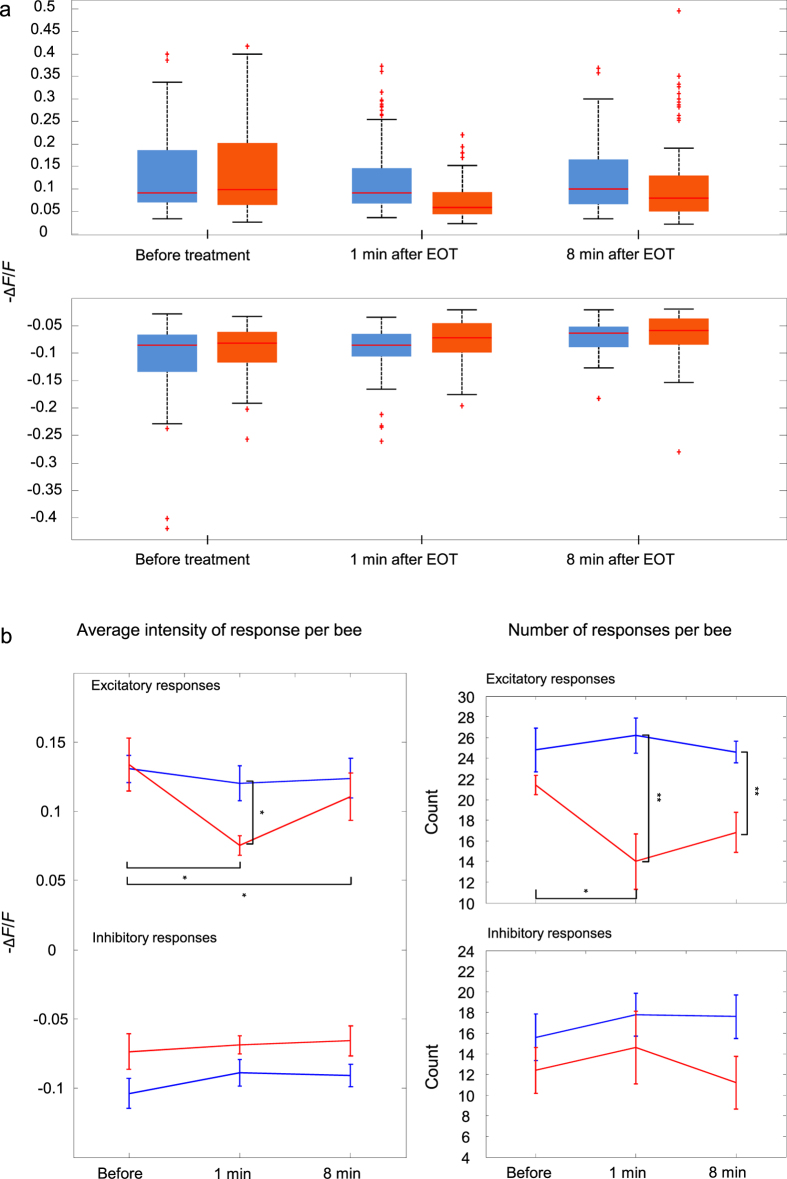
Figure 2. Odour-evoked glomerular responses were gathered and automatically classified in excitatory, inhibitory, or no response.
This was done for responses before treatment (Before), 1 min after EOT (1 min) and 8 min after EOT (8 min). The intensity (average −ΔF/F between 200 and 400 ms after odour onset) distributions of excitatory (top) and inhibitory responses (bottom) are shown in (a), with data from control animals (n = 5) reported in blue and those from treated animals (n = 5) in red. Boxplots indicate median, quartiles, and outliers of the distributions. In (b), the average intensity (−ΔF/F; left) and the number (right) of both excitatory and inhibitory responses across bees are shown (control bees, n = 5, in blue, and treated bees, n = 5, in red). Error bars represent SEM. Average intensity of excitatory responses varied following treatment (two-way repeated measures ANOVA showed a significant effect of time F2,16 = 9.4, p = 0.0020 and group × time interaction, F2,16 = 4.7 p = 0.025). Number of excitatory responses were also reduced by the treatment (two-way repeated measures ANOVA showed a significant effect of group × time interaction, F2,16 = 3.9, p = 0.042, and group: F1,8 = 17, p = 0.003). Pairs of measurements were further compared via paired and unpaired t-tests, respectively (*p < 0.05, **p < 0.01).

