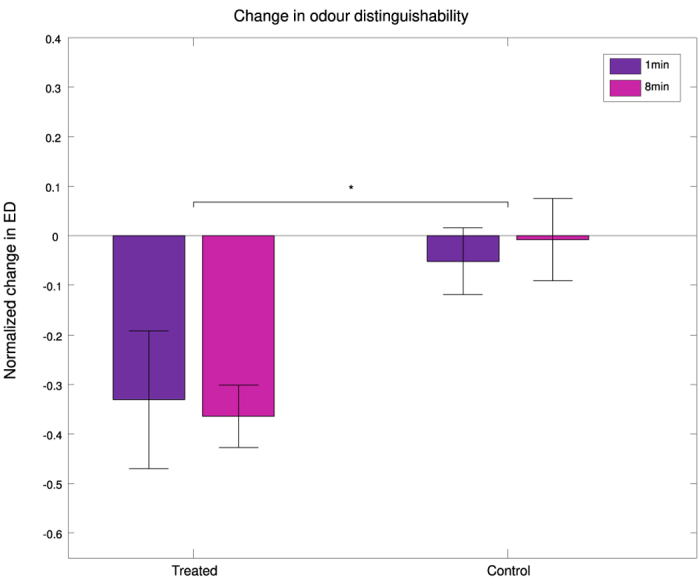
Figure 3. Normalized changes in Euclidean Distances over time (EDafter − EDbefore)/EDbefore in treated and control bees.

There is no significant effect of time on ED measurements, nor of time × group interaction. However, EDs are significantly reduced in the treated group at both time points after EOT (1 min: 1 min after EOT, shown in violet, and 8 min: 8 min after EOT, shown in fuchsia) with respect to the control group (n = 5 bees per group; two-way repeated measures ANOVA, group: F1,8 = 8.3, p = 0.020). Error bars represent SEM.
