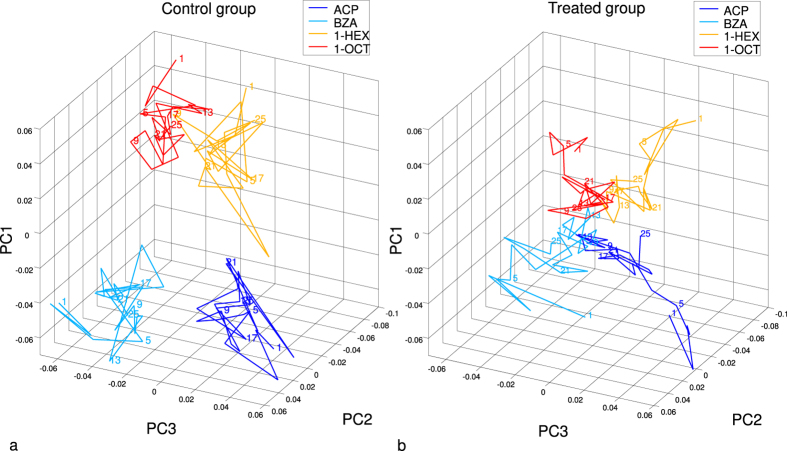
Figure 4.
Average odour representation in time (n = 5 bees per group; ACP: acetophenone, shown in blue, BZA: benzaldehyde, in cyan, 1-HEX: 1-hexanol, in yellow, and 1-OCT: 1-octanol, in red) during 25 stimulus repetitions (repetitions are marked by numbers along the trajectories) in control (a) and treated (b) bees. Imidacloprid was administered on average between trials 4.6 and 6.6 to the treatment group (b), while, in the same window, the control group (a) was administered with Ringer’s solution from a second vial. Odour responses are shown in principal components (PCs) in order to reduce the coding space dimensionality. PCs and axes are identical for (a,b), allowing comparison of odour code separation.

