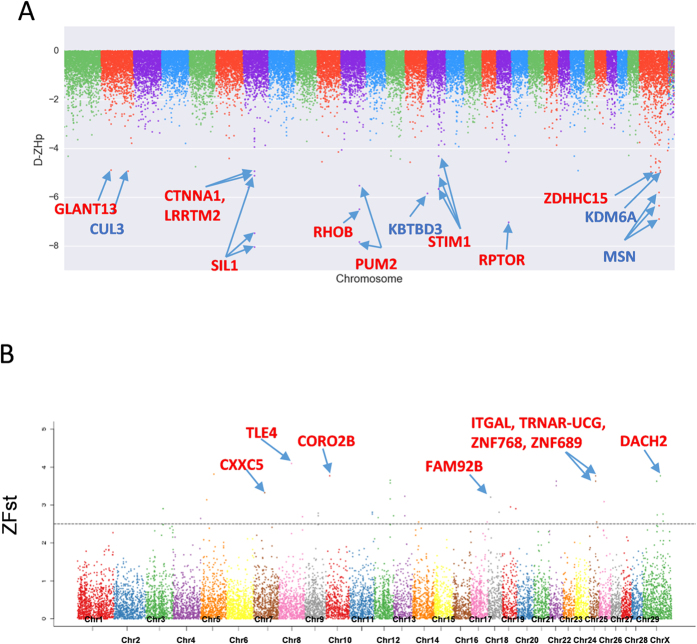
Figure 2.
(A) Genome-wide Z-transformation of differential heterozygosity (D-ZHp, ZHp-HF- ZHp-LF) manhattan plot between LF and HF groups. Red names are of some of genes contained in the minimum D-ZHp group in the 150 KB window. Names of red or blue mean homozygosis in the HF or LF groups. (B) Genome-wide Z-transformation of F-statistics (Z-Fst) manhattan plot between LF and HF groups. Red names are of some of the genes contained in the maximum Z-Fst in the 150 KB window.

