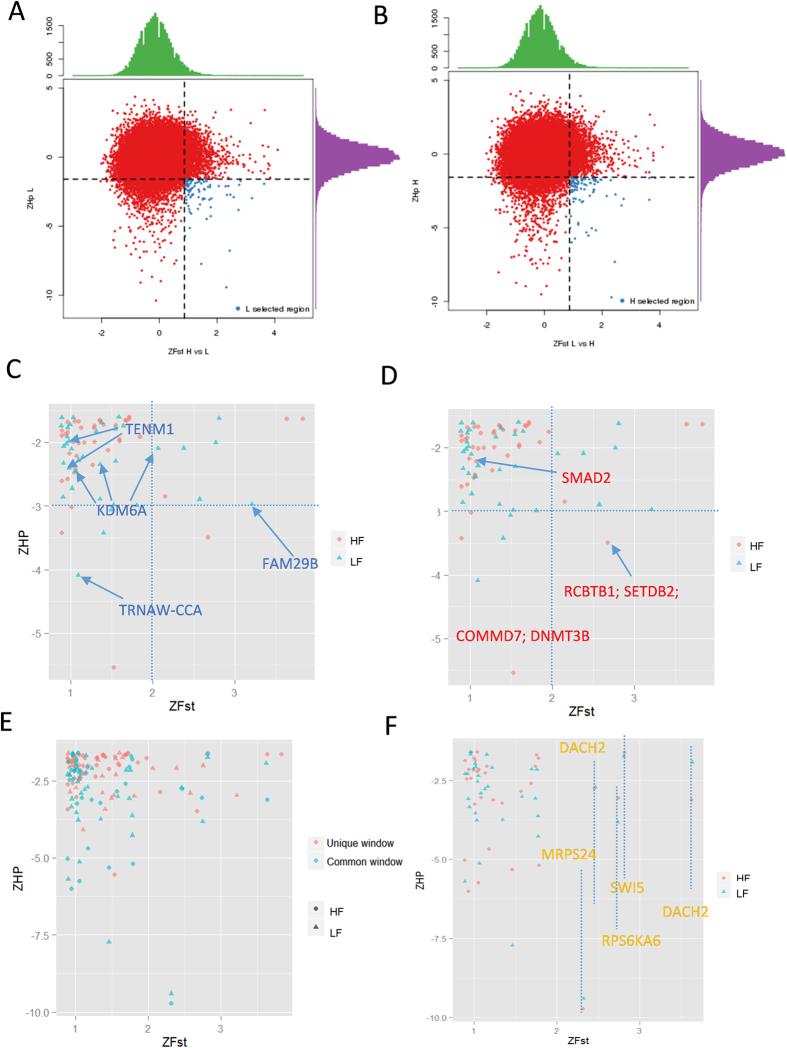
Figure 3. Distribution between Fst versus ZHp.
(A) Fst versus ZHp of each window in the LF group, the blue points show candidate windows different from the HF group and with more homozygous SNPs. (B) Fst versus ZHp of each window in HF group, the blue points represent candidate windows different from the LF group and with more homozygous SNPs. (C) Distribution of unique and shared candidate windows in the LF and HF groups, blue and red names are of candidate gene uniquely localized in the LF (E) and HF (F) groups. Distribution of shared candidate windows in the LF and HF groups. (D) The yellow color names are of the genes contained in the candidate windows.

