
Fig. 3.
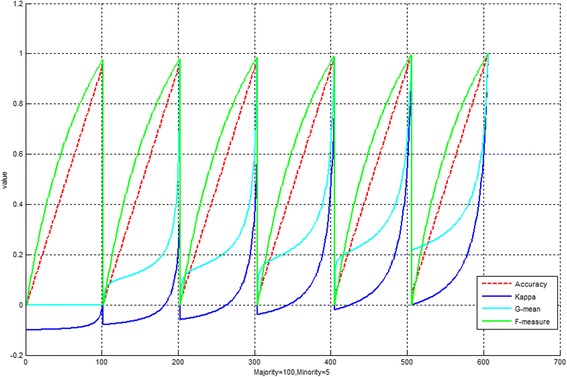
Snapshot of fluctuating values of accuracy and Kappa (an example of imbalanced dataset with 100 majority class samples and 5 minority class samples)
Official websites use .gov
A
.gov website belongs to an official
government organization in the United States.
Secure .gov websites use HTTPS
A lock (
) or https:// means you've safely
connected to the .gov website. Share sensitive
information only on official, secure websites.
Snapshot of fluctuating values of accuracy and Kappa (an example of imbalanced dataset with 100 majority class samples and 5 minority class samples)