
Fig. 1.
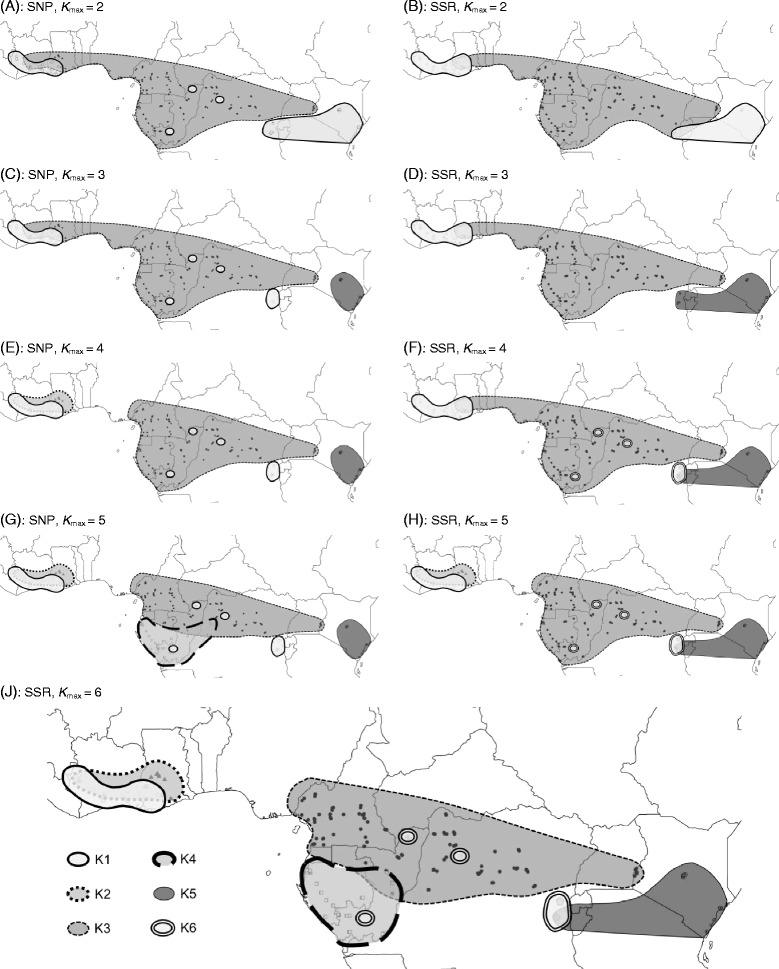
Evolution of genetic clustering among 435 Milicia samples according to K max. K max was increased from 2 (a, b) to 5 (g, h) and 6 (j) using nuclear SNPs (left; a, c, e and g) or SSRs (right; b, d, f and h). j shows the most likely scenario with K = 6 genetic clusters according to SSRs genotypes. Each combination of grey tone and type of outline stands for a given genetic cluster