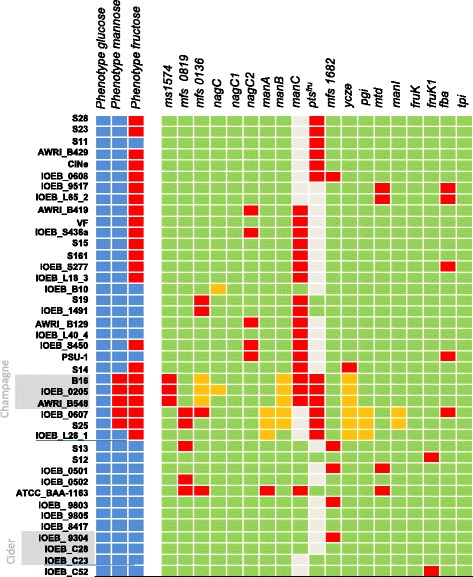
Fig. 3.

Genotype/phenotype correlations regarding glucose, mannose and fructose degradation. Strains appear in the same order as on the phylogenomic dendrogram (Additional file 2: Figure S2). In the lane for phenotypes, the blue color indicates that the strain is able to grow on glucose, fructose or mannose as the sole carbon source, and the red color indicates that the strain is unable to grow in such conditions. In the lanes for genotypes, a beige box indicates that the gene or the operon is absent. A red box indicates that the gene or one of the genes in the cluster (such as the pts operons manA, manB, manC and pts fru) is truncated or appears as a pseudogene. The green color indicates no gene truncation but mutations still can lead to inactive proteins. An orange box indicates that the corresponding genome sequence displays a specific gene mutation leading to a singular protein. The gene nomenclature is indicated in Fig. 2
