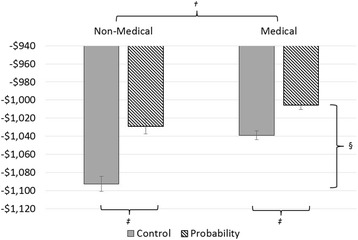
Fig. 1.

Expected Value estimates of Non-medical and Medical participants, stratified by presentation of explicit probability information. *Medical participants include medical students, residents, and faculty physicians. †Medical participants made better decisions than non-medical participants (mean expected value -$1022 versus -$1,061; p < 0.001). ‡Participants receiving probability information made better decisions than those presented with control control scenarios (mean expected value -$1017 versus -$1066; p < 0.001), but probability§ helped non-medical participants improve more than medical participants (mean improvement of $64 versus $33; p = 0.027)
