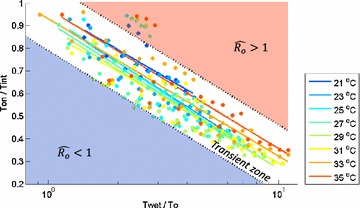
Fig. 3.

contour lines for different temperatures. Observed points for (circles) were fitted with natural logarithmic functions (solid lines) on the non-dimensional D1–D2 space for each temperature, where D1 = Twet/To and D2 = Ton/Tint. The x-axis in this figure is shown on a logarithmic scale. Each color represents a different temperature, which applies both to the circles and the lines. No line was drawn for 19 ◦C because almost no combination of conditions lead to . A natural logarithmic function fitted to all the observed points of reads as D2 = −0.27 log D1 + 0.94 (≡fo), and the area ±1.5 in y-direction from it is denoted as transient zone. Note that the figure contains the results from all the values of Twet, Ton and Xdist tested, as well as temperatures
