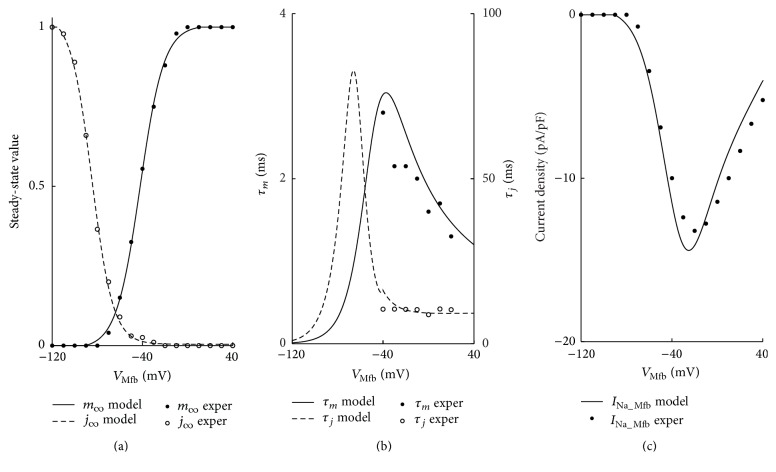
Figure 2.
Model representation of parameters describing I Na_Mfb. (a) Steady-state activation (solid line) and inactivation (dashed line) curves, (b) gating variable fast (solid line) and slow (dashed line) time constants, and (c) I-V relationship (solid line). Experimental data (filled and hollow circles) from Chatelier et al. is included for comparison.

