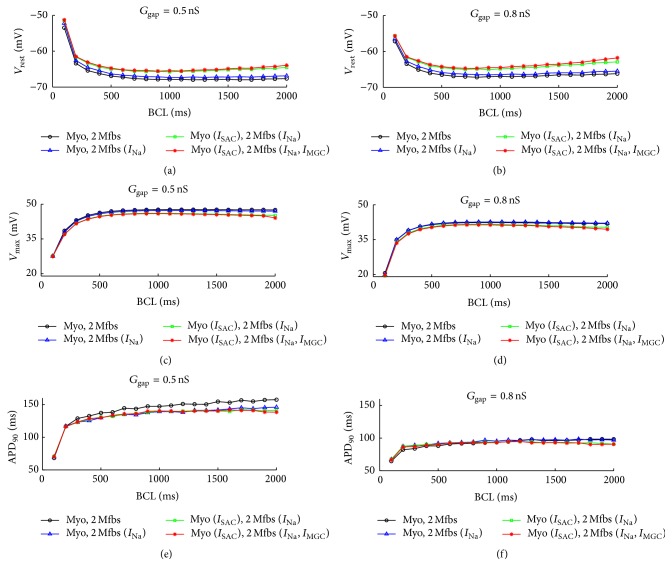
Figure 6.
Effects of I SAC, I Na_Mfb, and I MGC_Mfb on AP characteristics as a function of BCL in Mfb-M coupling with I Na_Mfb (blue line with hollow triangle), with I SAC and I Na_Mfb (green line with hollow rectangle), and with I SAC, I Na_Mfb, and I MGC (red line with asterisk) as compared to control (black line with hollow circle), by coupling two Mfbs to an atrial myocyte with G gap of 0.5 and 8 nS. (a, b) V rest, (c, d) V max, and (e, f) APD90.

