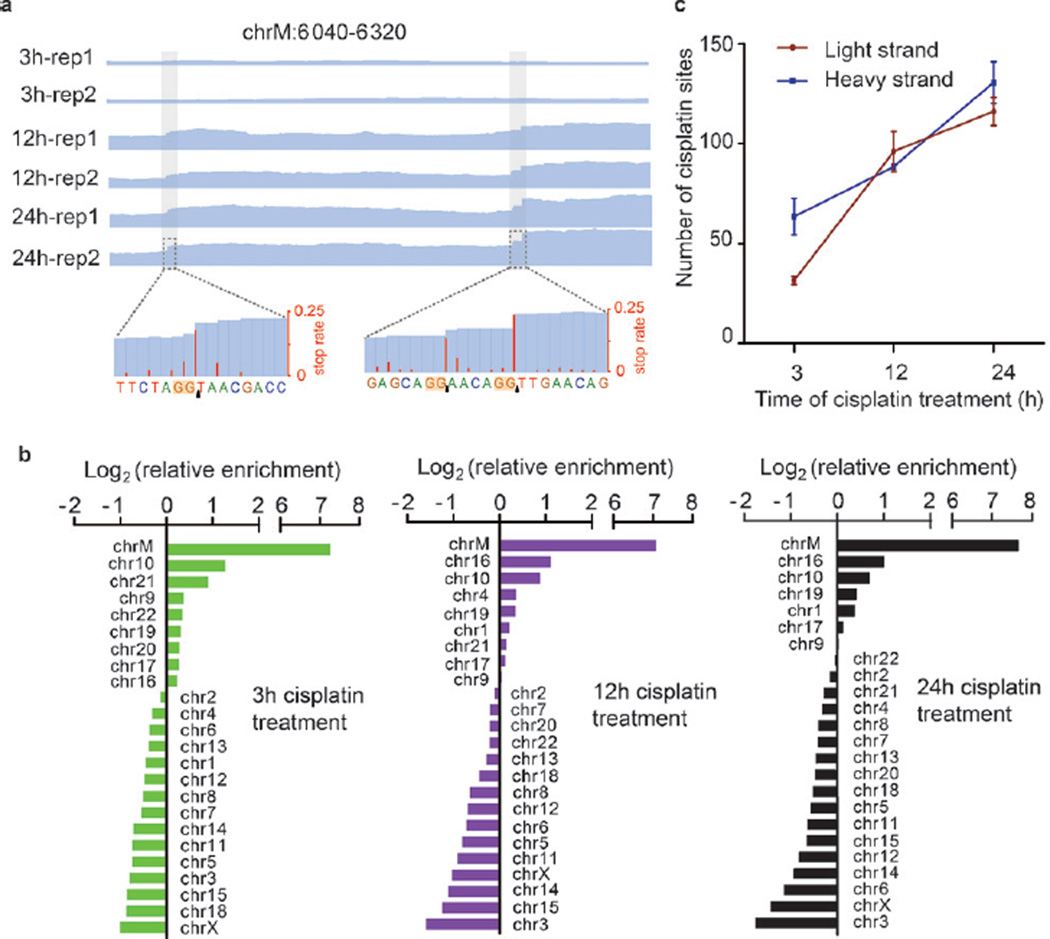
Figure 2.
Mitochondrial DNA is a preferred target of cisplatin. a) IGV views of representative cisplatin sites. Blue lines are sequencing depths; the enrichment of regions containing cisplatin modifications also gradually increased from 3 h to 12 h and 24 h. In the zoom-in view, both single and consecutive cisplatin crosslinking sites can be identified. b) Relative enrichment of cisplatin sites on each chromosome. Enrichments were normalized by the sequencing coverage of each chromosome in the “input” sample. c) The number of cisplatin sites in light and heavy strands of mitochondrial DNA after 3 h, 12 h, or 24 h of cisplatin treatment.

