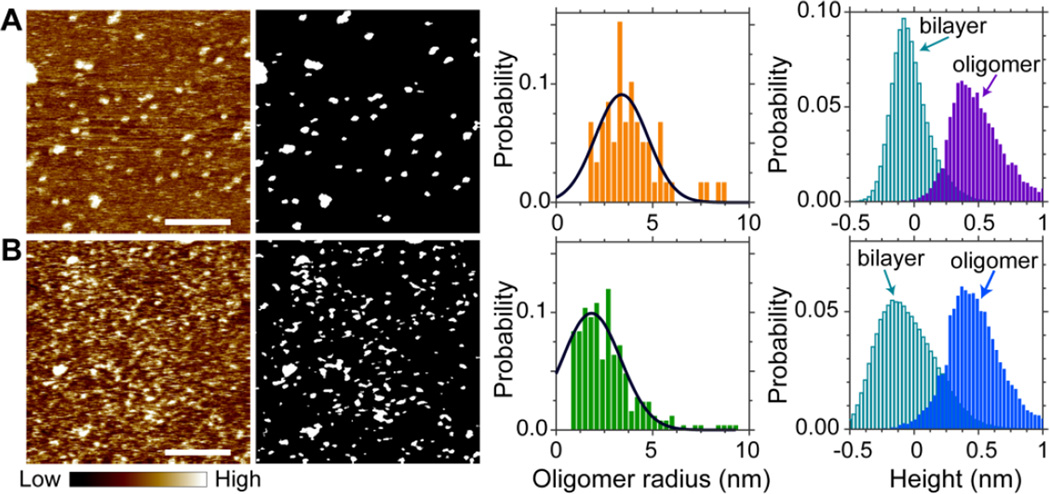
Figure 1.
Solution AFM height images of 4mol% M2TM in planar bilayers composed of (A) DOPC and (B) DOPC + 20mol% Chol. Height-scale indicated by the color bar is 1.5 nm. Scale bars = 80 nm. Gray-scale binary images show oligomers determined by Matlab image analysis. Gaussian fitting (solid lines) indicates that the most probable oligomer radius is 3.4 nm for the DOPC/M2TM bilayer, and 1.8 nm for the DOPC/Chol/M2TM bilayer. Height probabilities are calculated separately for oligomers and the rest of the bilayer.

