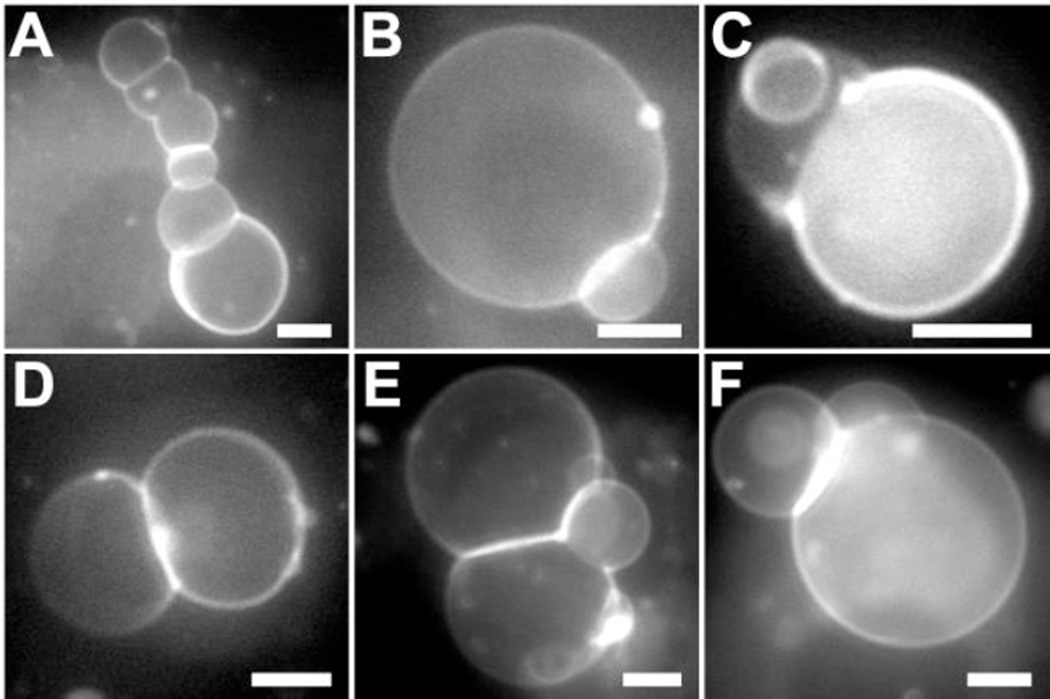
Figure 8.
Fluorescence images of GUVs (DOPC/eSM 3:2 + 32mol% Chol) after being exposed to 2.3 µM M2TM. (A) Inter-connected vesicle chain, (B) small cap budding, (C) small and intermediate cap budding, (D) hemispherical budding, (E) three-cap interconnection, and (F) two-cap budding. Scale bars = 10 µm.

