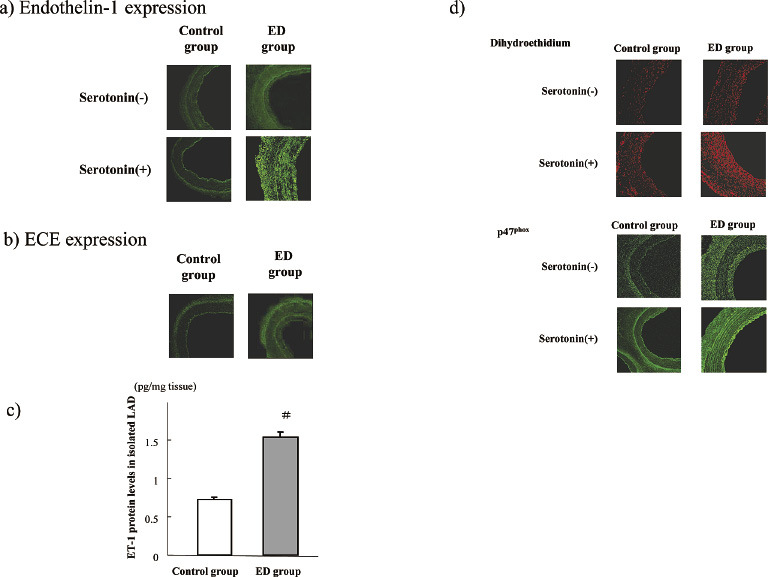
Fig. 6.

Expression of endothelin-1 (ET-1) and superoxide.
Representative images of ET-1 (a) and ECE (b) fluorescences in the isolated samples of the repeatedly denuded coronary artery sample (ED group) and the corresponding control artery sample at week 8 (2 weeks after 4 endothelial denudation procedures in the coronary artery). ET-1 fluorescence and protein levels of ET-1 determined using the ELISA method (c) increased in the ED group compared to those of the control group. ET-1 fluorescence augmented after the exposure of 1 µM serotonin in the ED group (a). ECE was slightly observed at week 8 in the control group whereas ECE increased at week 8 in the ED group (b). Moreover, dihydroethidium and P47phox fluorescence increased in the ED sample, which was augmented by the exposure of 1 µM serotonin in the ED group (d). The bar graphs are shown as the means ± SEM, n=8 each, #; p<0.01 vs control group in the same condition.
