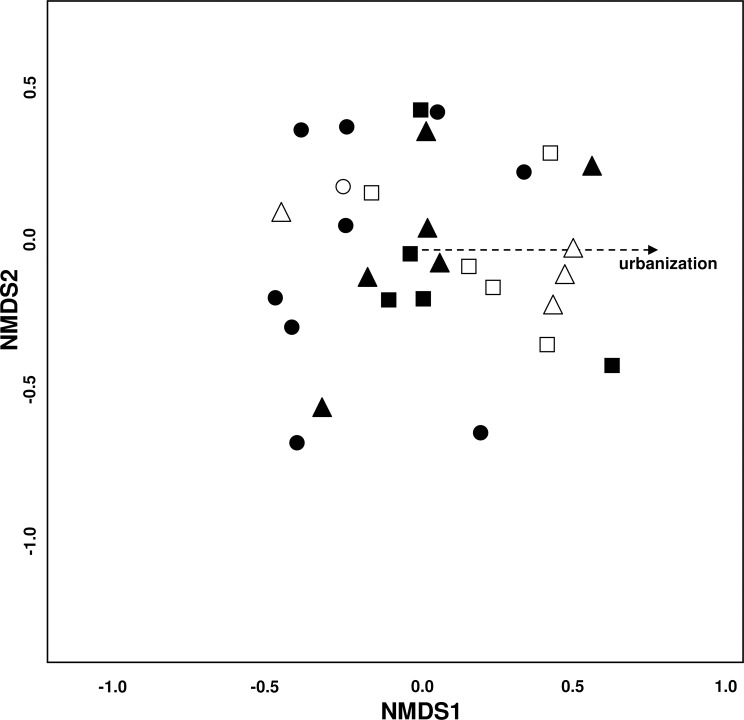
Figure 3. Variation of bee species assemblages among different levels of urbanization and restoration.
Non-metric multidimensional scaling (NMDS) ordination (stress = 0.19). Environmental variables fitted onto the ordination plot: dotted line: P = 0.05−0.1. Symbols for study sites: site with ● = low (−3.4 –−1.27), ▴ = medium (−1.26–1.67), and ■ = high (1.68–3.18) urbanization degree. Empty symbols incidicate sites that have undergone restoration measures.

