
Figure 5.
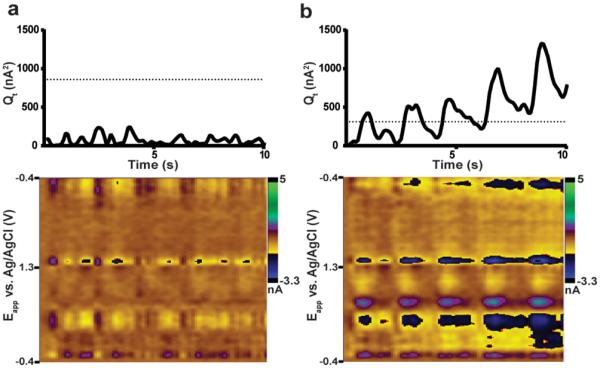
Residual analysis with different training sets. a) The residual trace and color plot from a training set built in the same subject (E). The residual trace remains below the residual threshold (dotted line, Qα = 858.8). The residual plot contains a small amout of unaccounted current at potentials where dopamine and pH contribute. b) The residual trace and color plot from a training set built in a different animal (C) applied to these data. The residual trace rises throughout the trace and crosses the residual threshold (Qα = 312.0). The residual color plot reveals large sources of discarded current near potentials for dopamine and pH.