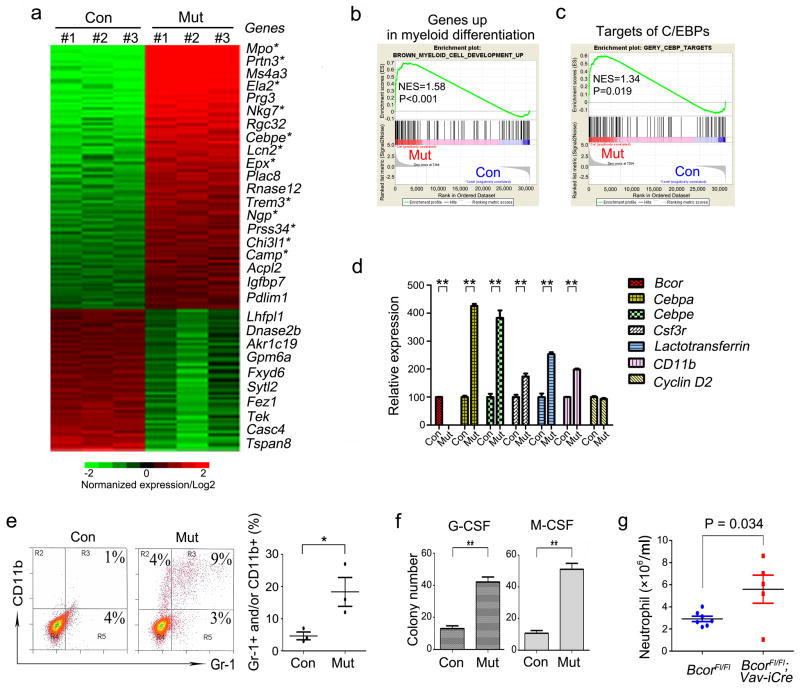
Figure 2.
Bcor deletion in BM cells induces myeloid cell differentiation. (a) Heat map of genes with > 2 fold and P < 0.05 mRNA expression differences between BcorFl/Y (Con) and Bcor−/Y (Mut) myeloid cells cultured with IL-3, IL-6 and SCF. 850 genes were upregulated and 400 genes downregulated. The top 20 upregulated and the 10 most downregulated genes are named. * genes associated with mature myeloid development. (b, c) GSEA comparison of control and Bcor mutant myeloid cells for enrichment/depletion of genes up-regulated in myeloid cell differentiation (b) and CEBP’s target genes (c). The normalized enrichment scores (NES) and P values are indicated in each plot. (d) qRT-PCR analysis of the indicated genes. Relative mRNA amounts were normalized to Gapdh. Values are expressed as fold variation relative to control cells (Con); results are mean ± SD of three experiments. Bcor primers are primers internal to the deletion. (e) Representative FACS analysis of Gr-1 and CD11b in control and Bcor mutant cells cultured under myeloid stem/progenitor conditions (IL-3, IL-6 and SCF) is shown (left). Statistical analysis for Gr-1/CD11b FACS analysis of three different batches of cells is shown (right). (f) Methycellulose colony assays for control and Bcor mutant cells with either GCSF (50 ng/ml) or MCSF (10 ng/ml). Colonies were counted on day 10 of culture. Values are expressed as colony numbers with means ± SD of three experiments. (g) BcorFl/Fl mice were crossed with Vav-iCre to delete Bcor in the hematopoietic lineages. Analysis of peripheral blood (HemaVet, Drew Scientific, Miami Lakes, FL, USA) of aged mice (~6–18 months) showed higher neutrophil levels in BcorFl/Fl;Vav-iCre compared to BcorFl/Fl littermate controls. *P < 0.05; ** P < 0.01 (two-tailed, Unpaired t test).

