
Fig. 2.
Relationship between the hazard of HIV acquisition and migration distance expressed in kilometers per year for men (top) and women (bottom).
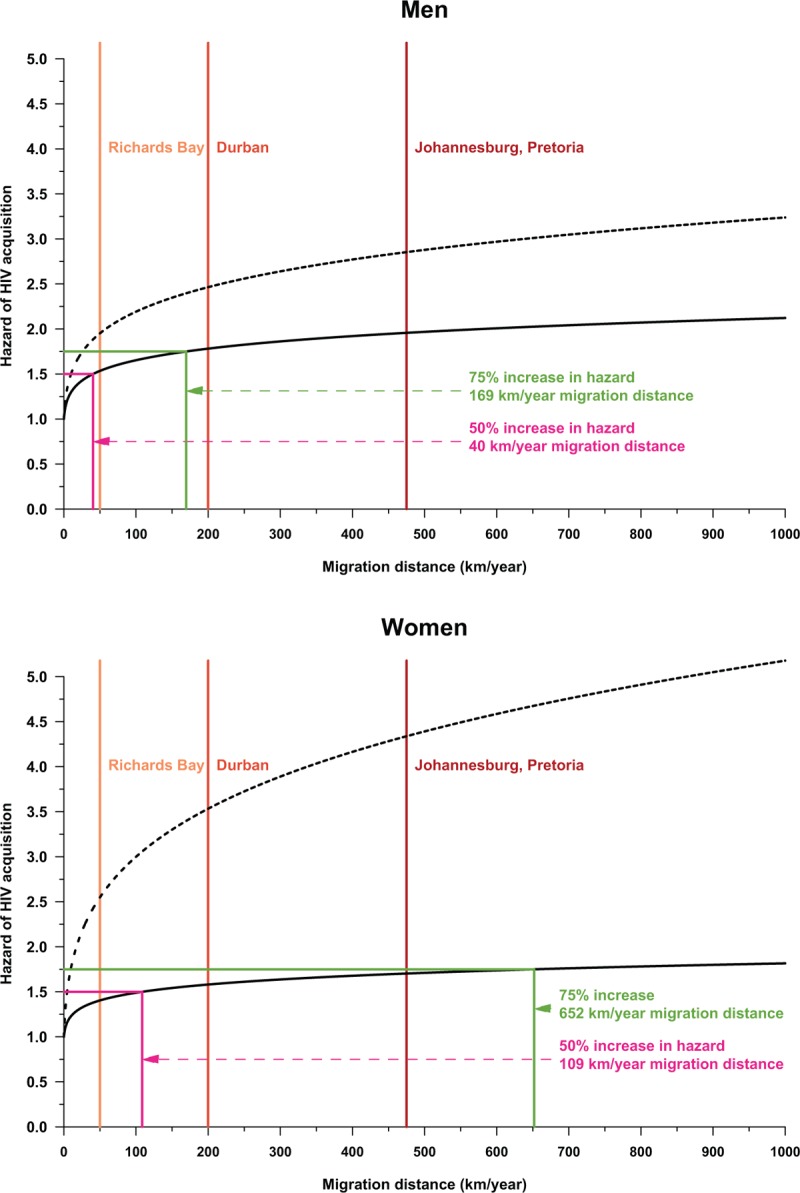
The black solid lines give the adjusted hazard of HIV acquisition for migration distance, whereas the dotted lines give the unadjusted hazard of HIV acquisition. The colored lines show the number of kilometers per year of migration distance that correspond with a 50% or a 75% increase in the adjusted hazard of HIV acquisition with respect to men or women that do not move outside the rural study community. The solid vertical lines show approximate distances from the rural study community to the metropolitan areas of Richards Bay, Durban, and Johannesburg/Pretoria.